Data rules the tech world. Data, data, data. There is data that needs to be seen by a user, data to be reviewed by a data scientist. Data for investors. Data for management. Data. For any organization, how you structure and store your data informs your potential success.
The company storing their data in hand-written Microsoft Word documents is a step behind the company storing their data in easy-to-read Excel charts on a cloud server. Innovation continues in the database world—these are graph databases.
(This article is part of our Data Visualization Guide. Use the right-hand menu to navigate.)
How traditional databases work
Data has traditionally been stored in tables. For the coffee shop industry, you may probably see a set of tables appear like this:
| Coffee Shop |
|---|
| Name |
| NOVO |
| Steam |
| Thump |
| Corvus |
| Customers | ||||
|---|---|---|---|---|
| CustomerID | Name | BDay | Phone | |
| 123461 | Jack | 1-1-1970 | a@b | 1 |
| 41263 | Jim | 1-1-1970 | b@c | 2 |
| 45714 | Jill | 1-1-1970 | c@d | 3 |
| 71129 | Jerome | 1-1-1970 | d@e | 4 |
| 90123 | Jeb | 1-1-1970 | e@f | 5 |
Then, there are separate tables to store all the orders, employees, inventory, and suppliers. We have 6 data tables to store the data of the coffee shop industry. In the traditional relational database, each new relationship that is wished to be known requires a new table to store information.
While inventory items might work well in tables, they are limited when expressing relationships between entities.
In traditional databases, answering relationship questions requires IDs to be double-entered across tables, then a number of join statements to say something like, “Return all values where ID-1 matches other ID-1’s in all these sets of tables. Then, look at other common IDs that appear in the tables with ID-1, and also find those IDs across all sets of tables.”
The Cornell Movie Dialog Corpus is a traditional database. To know who said what in what movie, you have to cross-reference the IDs with the movie line to be able to see that the line “Here’s to looking at you, kid” was spoken by character ID 546 (Humphrey Bogart) and movie ID 123 (Casablanca).
You can answer relational questions with traditional SQL and noSQL databases, but only through a well-thought out question that states explicitly what sets of tables to explore and to join (tremendous amounts of work). Then, wait a while for the query to be returned.
Queries about relationships in non-graph databases don’t scale well. The relationship questions in relational databases can take minutes, where the same query in a graph database can take seconds.
What is a graph database?
As people move into an increasingly interconnected society, connections need to be expressed. From social media feeds to show who are friends of whose, to recommended lists to show people that like these songs or videos also like these, to identifying the rogue member of the group who is most likely a threat, graph databases help store this information and query this information with ease.
Graph databases are used to understand highly interconnected data. They are great at exploring the relationships between data. By design, graph databases can easily answer these types of questions:
- Do the user’s friends like the same music as the user?
- Is it the case that this fraudulent user could be detected because it has fewer relationships to other members of the group?
- If this person knows these types of things, what are the chances they will connect the dots to learn these other types of things?
Use cases
Graph databases are schema-less and mutable. Graph databases are particularly good to use when you need to:
- Explore the relationships between data
- Easily scale queries to increasing amounts of relationships
Example use cases for graph databases include:
- Fraud detection
- Real-time recommendations
- Data management
- Identity management
- Network and IT operations
The three graph components
The concept of a graph is a math term, originating with graph theory. The graphs of graph theory can be thought of as trees, networks, webs, or mind-maps. Pick your demon. They all consist of the same parts:
- Node
- Edge
- Graph
Node
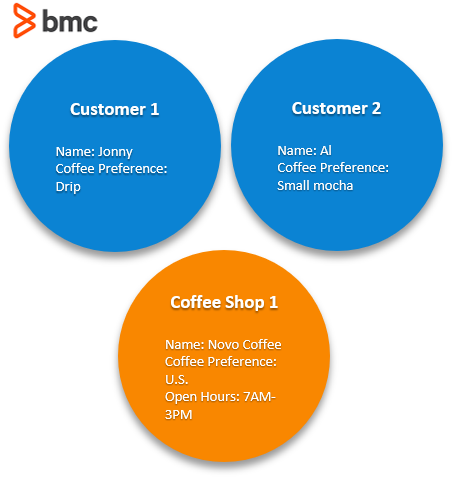
The basic element of the graph is the node. These are each point along the graph:
- One node contains data like the customer name and the customer coffee choice.
- Another node on the same graph might have the name of a coffee shop, its address, and its hours of operation.
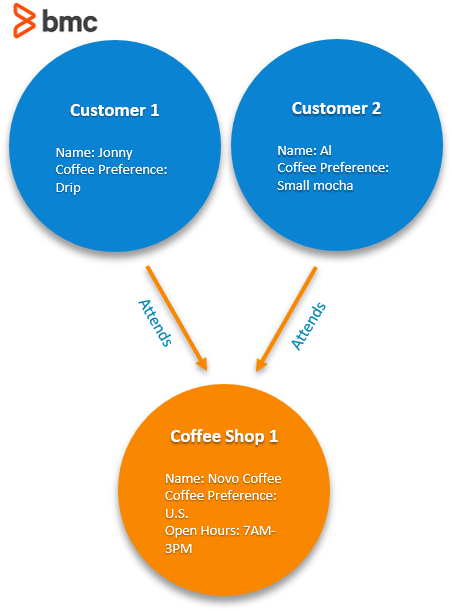
Edge
The edge on the graph defines the relationships between the entities. For our two customers, above, we can say they both “attend” the coffee shop. The nomenclature will vary based on your organization and needs. For example, “attends” can be replaced with customer, shopper, patron, user, etc.
Graph
Finally, we have our graph of nodes and edges. From it we can express the relationships such as, “Customer 1 and Customer 2 both attend Coffee Shop 1” and “Only Customer 1 attends Coffee Shop 2”.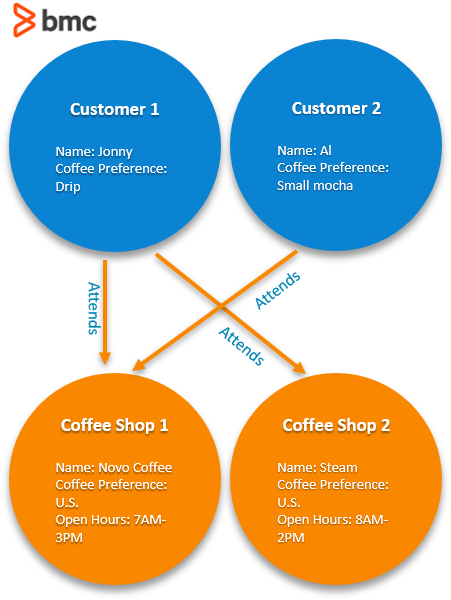
We could add many more relationships to this graph. Within this chart we could:
- Show the suppliers to each coffee shop.
- Add family and friends of these two customers, creating an edge “family”, “brother”, “friend” to the network and show what their coffee preferences are, then also use the “attends” edge to express which shops they attend.
These graphs can get incredibly complex.
Popular graph tools from cloud providers
Neo4j is one of the biggest players in the graph world, and they are creating a Kubernetes infrastructure that can implement the graph database on any cloud service. This means you can implement graph databases on AWS, Azure, and GCP.
While Neo4j takes some extra work to get up and running, AWS offers Amazon Neptune, a ready-to-go graphs infrastructure on AWS. Another good graph alternative is Cayley, which is open source and usable on GCP.
What other good graph options have you come across? Please reach out and let us know.
Additional resources
For related reading, explore these resources:
- BMC Big Data & Machine Learning Blog
- Data Visualization Guide, a tutorial series
- Tableau Online Guide, a tutorial series
- Data Lake vs Data Warehouse vs Database Explained
- Who Cares How Big the Data Is? It Doesn’t Really Matter
- DBMS: An Intro to Database Management Systems